Data is the key component of business logic and extracting meaningful intelligence out of the enormous amount of data. Reliable data insights is critical to make successful business decisions. The Business Intelligence(BI) tool Tableau has evolved to aid businesses in gaining deeper insights in to data with the help of better data visualization & data analytics methods. In this post, we present how Tableau solves the data visualization & data analytics problems.
Data Visualization Challenges With Legacy Tools
To better understand digital visualization challenges, first let us understand what exactly data visualization is. As defined by Oracle, "Data visualization is the presentation of abstract information in graphical form. Data visualization allows us to spot patterns, trends, and correlations that otherwise might go unnoticed in traditional reports, tables, or spreadsheets."
In the early days of data sciences, businesses were suffering to calculate margins around the globe. They used to maintain data by Excel, CSV, MS Access Application, Flat files etc. It was very tough to maintain & visualize data. Especially when connecting to legacy systems, fetching data takes so much time & estimating the time to extract is not constant every time. Even after development, we must check whether the data visualization are similar on all the browser platforms or not.
After completing development, we need to host manually on either the individual server or cloud servers. This takes huge time to publish the report. After publishing the report, we need to provide authentication & authorization for security purpose. Authorization is to validate the user and ensure that user is having permission to view or not.
What is Tableau?
From connection through collaboration, Tableau is the most powerful, secure, and flexible end-to-end analytics platform for your data. Elevate people with the power of data. Designed for the individual, but scaled for the enterprise, Tableau is the only business intelligence platform that turns your data into insights that drive action."
Ways Tableau Solves Data Visualization & Analytics Challenges
Conducting data visualization with Tableau can be a game changer for organizations to solve their data visualization challenges. Below is the list of ways Tableau solves most of the data visualization challenges that are hard to solve for legacy tools:
1. Wide-range of options
Tableau comes with an extensive list of options. Using Tableau one can easily connect, extract data and draw data visualizations from any data source having different data representations. Below is the screenshot presenting a list of options
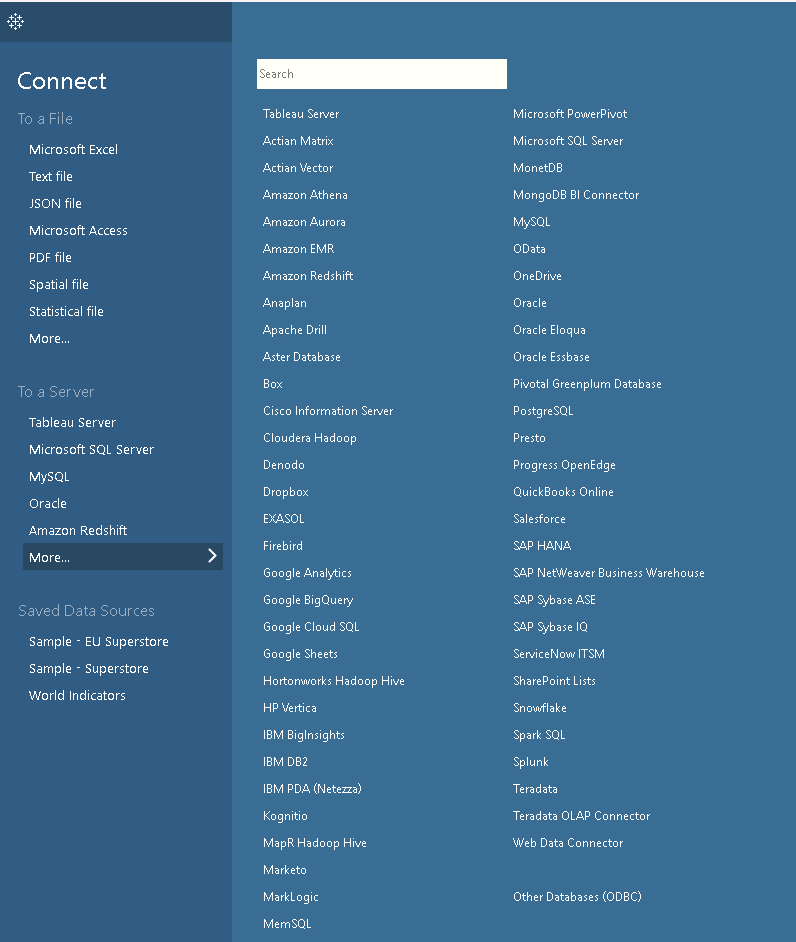
Figure: Tableau Dashboard Various Options
2. Stop Coding! It’s Drag and Drop Now
In earlier days, even to generate a simple data visualization one must have to write thousands of lines of code by spending hours; which is costly and time-consuming process. In contrast to this, data visualization with Tableau keeps aside this coding overhead by simplifying with drag and drop options to generate any type of data analytics and visualizations reports. Tableau comes with built in table calculations to conduct any complex analysis by a click of mouse.
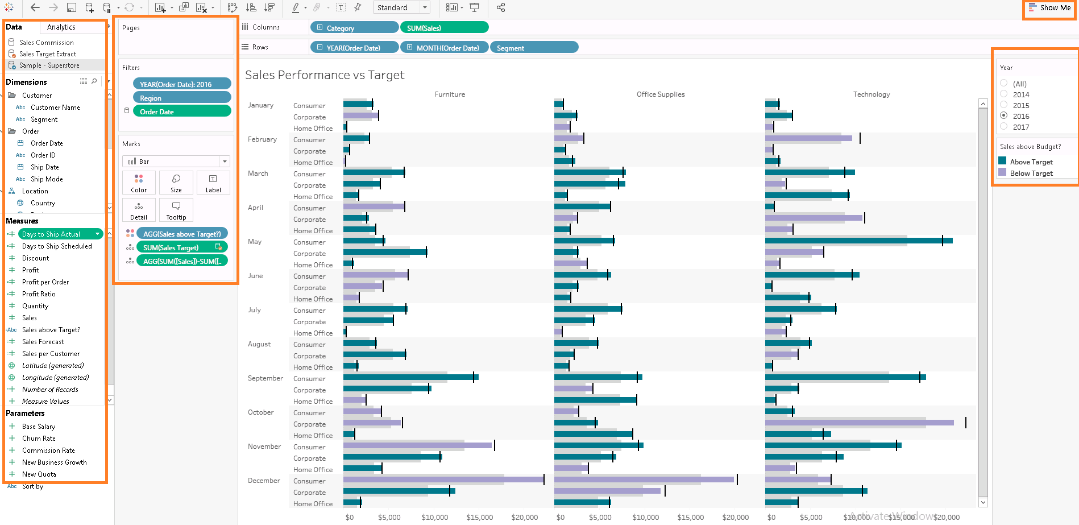
Figure: Tableau window showing many options and respective data visualizations of varied timelines.
3. Interactive Dashboards
Usually after publishing reports, users need to conduct browser platform compatibility tests to ensure that no variations exist in the data visualization reports. But, with Tableau users need not to worry about the variations in data visualizations, the interactive dashboards take care of this overhead from user and ensures uniformity. Refer below screenshot of interactive dashboard.
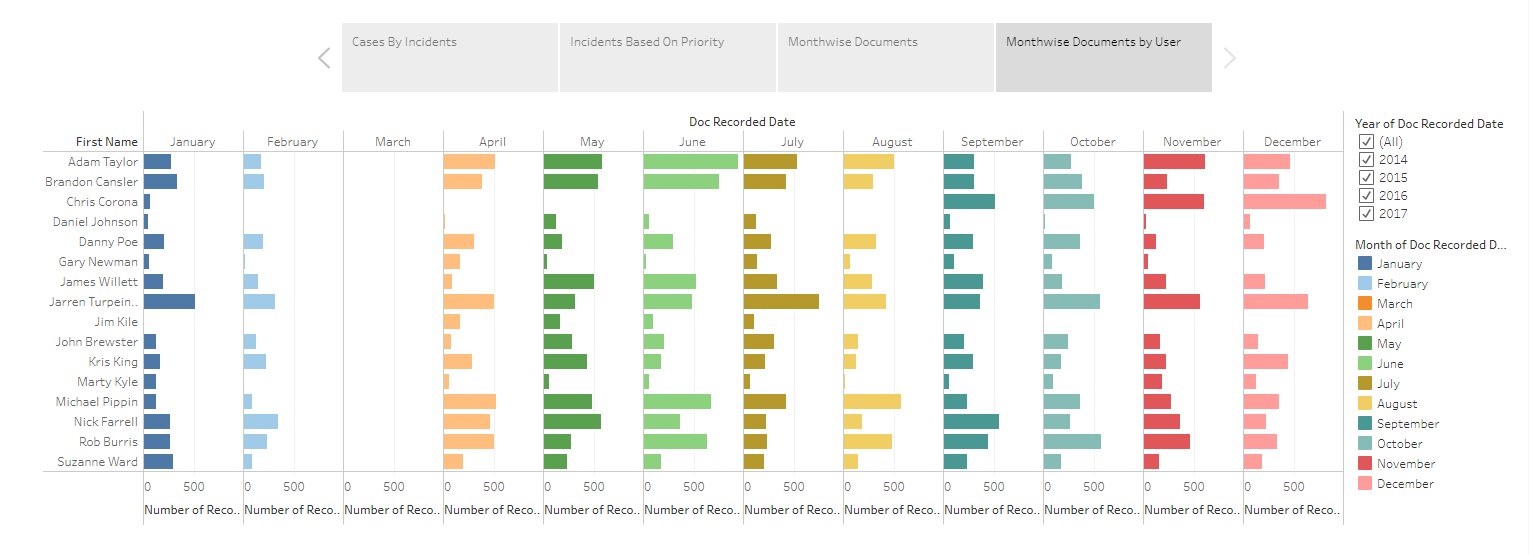
Figure: Tableau Interactive dashboard
4. Publishing Made Simple
To publish any report or application we need web servers (like IIS, Apache, and so on) and involvement of IT teams to publish reports on servers by following hectic procedures. But, to publish tableau reports the need for IT people support isn’t required. We can easily publish dashboards to cloud platform & can share reports globally to any location.
5. Ad hoc Analysis
As quoted by SISENSE, “Ad-hoc analysis is any business report or data analysis curated and created by users, as and when they need it”. In web authoring and Ad hoc analysis, authorization is the key.
Here. authorization refers to how & what users can access on tableau server. It includes projects, sites, workbooks & views. Permissions are asset based on content assets (projects, data sources & workbooks) are granted to users or groups. Tableau gives complete control to organizations to control the real-time customer data and to build high value customer segments by understanding how they interact with the dashboards.
6. Get Email Alerts On Changes
Tableau permits users to set email alerts if any problems are identified in the server. Then it would be easy to troubleshoot the problems. Tableau allows configuring of email alerts can be configured for:
- System failures
- Server shutdown
- Disk space usage
- Usage history
- Email alerts when space crosses or remains below pre-configured thresholds
7. Deployment Made Simple
To deploy any reports or applications we need to check lot of things like frame work, folder permissions, etc. Without worrying about all these issues, in tableau we can deploy our projects, data sources & workbooks easily.
8. Easy to back up & Restore
Earlier FTP was used to take backup of any application or reports from the server. This is cumbersome process and one has to rely on IT teams for help. Instead with Tableau, we can easily take back up of projects, data sources & workbooks as vice versa with single click.
Conclusion
Extracting analytics out of the data is to key to drive business decisions. In this process, above mentioned points clearly projects the capabilities of Tableau in enabling businesses to better understand the data with help of better Data Visualization & Data Analytics. Thus proving itself as one of the best-in-class BI tool.

About The Author

Suresh Karri is the Technical Lead for the Enterprise Application Development at V-Soft Consulting. He holds 7+ years of experience in Application Development & Database Design. Apart from these, he also possesses great amount of skills in building Web, Windows and Dashboards applications using technologies like Microsoft, Angular, Tableau and so on.