Tableau is a robust Business Intelligence (BI) tool that comes with a wide-range of data visualization and analytics capacities, to enable businesses to gain deeper insights into the vast enterprise data and drive better business decisions. This application facilitates easy integration with any data source of varied data representations and effortlessly extracts and maps data to generate data visualizations in interactive dashboards. Let's examine how Tableau transforms and blends data using the Data Blending feature.
Ways Tableau Transforms Data
Clean Data with Data Interpreter
After importing data using available data sources, if Tableau detects any discrepancy within the data, such as improper display of header column names. In such cases, Tableau offers a “Clean with data interpreter” option to clean data. The option will remove extra information and share information about what tableau has done. Upon clicking the button, an excel file will be opened and the data will be added to green section and headers will be added to orange sections.
Split Fields
After importing data using available data sources, using the split option we can split columns. For example, if one column has state and city data, using a split option will make it easy to divide those data points into 2 fields and will change the header names to "state" and "city".
Merge Data with Unions
Using tableau, we can merge data into one table and combine 2-column data into single columns.
Adding Relationships with Joins
Tableau provides different types of joins like Inner, Outer, Left, Right, & Full Outer. Using these joins, we can transform the data as needed.
How Tableau Displays Data in Reports Using Data Blending
Tableau Analytics dashboard displays data as views. Before this, data imported from different data sources were classified into measures & dimensions. Using the data blending technique, data coming from numerous data sources is combined into a single view. Using the data blending feature in Tableau, we can directly display information in the view by combining different data sources (as shown in the image below).
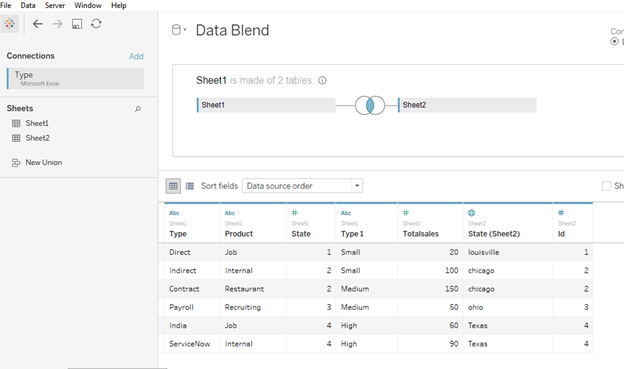
Figure: Add Relationships in Data Blending Process
Key Aspects of Data Blending
- Data blending works on a sheet by sheet basis
- The primary data source is marked in blue, any secondary data sources and fields are marked in orange
- Shared file names that are determined automatically by linking fields or relationships for blend will be created manually
- Data blending behaves similarly to a left join, which may result in missing data from the secondary data source
- Asterisks (*) indicates numerous dimension values in a single mark because data blending considers aggregated results and combines them in one view
Steps for Data Blending
Data blending is an efficient tool to combine multiple data sources. It is important to remember that data blending used to link fields vary from sheet to sheet.
To create a blend in the workbook, it is mandatory to connect at least 2 different data sources. First, we should identify common fields from both data sources and then bring the first field from one data source to the sheet, this becomes the primary data source and will be marked blue (refer below screenshot). After selecting the field from other data sources, it automatically becomes a secondary data source on relationship pane and marked orange.
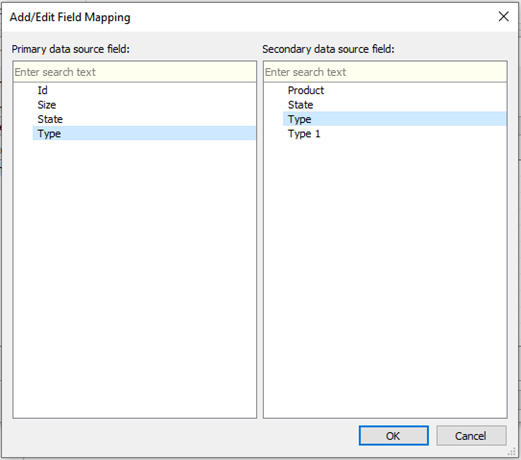
Figure: How to add data blend feature using different data sources
Data Blending Limitations
There are some data blending limitations such as:
- Non-additive aggregates (COUNTD, MEDIAN, and RAWSQLAGG)
- When published, blended data sources are published one by one in the same server and do not publish as a unit
- For secondary data sources, data must always be aggregated in calculations
Conclusion
Tableau's data blending feature helps connect and source data from multiple data sources and provides relationships, combines data, generates reports easily. This allows businesses to avoid using third party tools and applications to connect and source data from various enterprise systems. This saves effort and time for businesses. The blending feature allows businesses to gain deeper intelligence information from enterprise data.
 About Author
Suresh Karri is the Technical Lead for Enterprise Application Development at V-Soft Consulting. He holds 8+ years of experience in Application Development & Database Design. Apart from these, he also possesses skills in building Web, Windows and Dashboard applications using technologies like Microsoft, Angular, Tableau and more.