Customers often ask, “Why do I need ServiceNow Performance Analytics (PA) when ServiceNow comes with plenty of reports?” This is a fair question and jumps right to the root of any analytics discussion, but there’s more to consider. Here we share the power of PA within your investment, and reason you should turn your ServiceNow capabilities up a notch if you find the value.
Performance Analytics vs ServiceNow’s Basic Reporting
There are many aspects to be contrasted between business analytics and basic reporting. Basic reporting allows you to understand what is happening in real-time. Within service management, this could serve as an ad-hoc request for finding the number of tickets a team is currently working on, how many are open and how many were closed today.
There’s no question that this information is useful. ServiceNow reporting provides a clear snapshot of what’s occurring now. But what if you need to understand trends like “are we improving”, or “how many tickets are we resolving on the first call”, or “where are we spending most of our time?” This is where the power of analytics shows its skill.
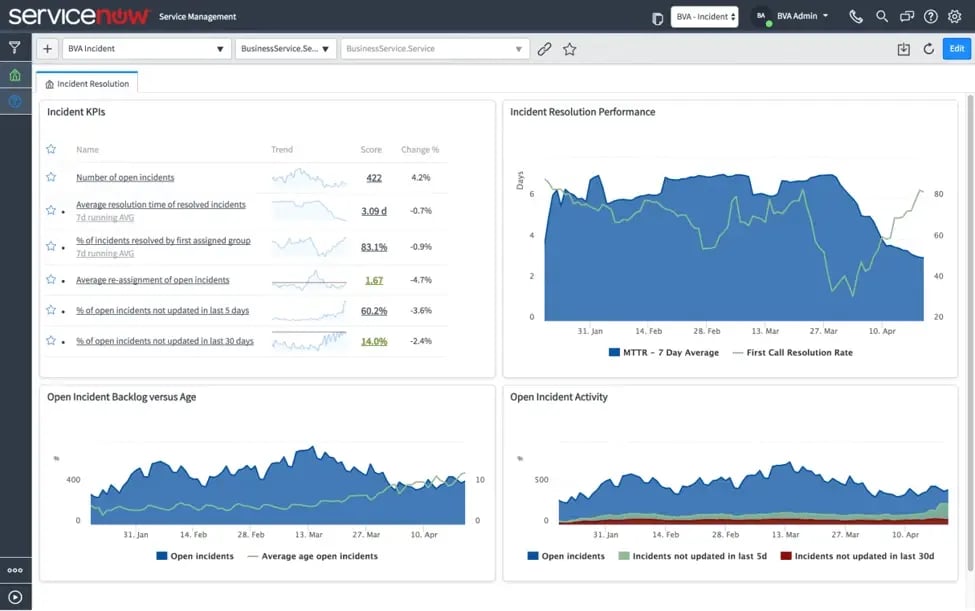
ServiceNow Performance Analytics (PA) provides archival context so that you can answer questions that speak straight to the comprehensive wellness of your business. Generally, only one dashboard can show more useful information than spending hours of a day looking at spreadsheets as the image below:

At a quick analysis, you can see key performance indicators (KPI’s) like how many tickets are resolved in the first call, the average time it takes to resolve a ticket, trends over previous months, the average lifespan of a ticket, how many are aging and the number of tickets that haven’t been recently updated.
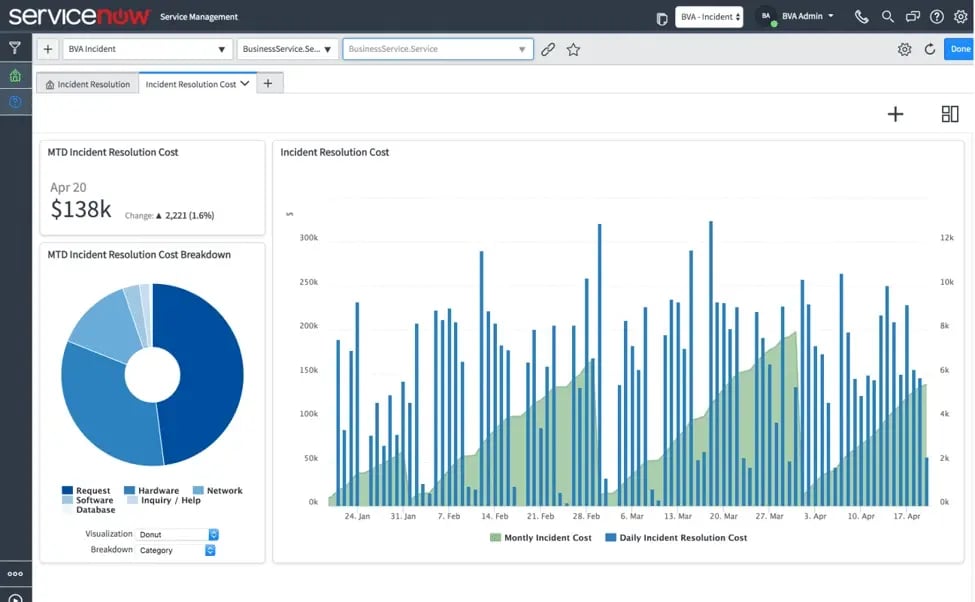
Without historical context, it is challenging to monitor and measure the health of your business, and looking at daily reports can only reveal so much. A few examples of the power of analytics: when you need to know what impact of a new hardware upgrade has on your incident resolution cost, you can utilize PA to see your ticket distribution over time as shown in the dashboard below.

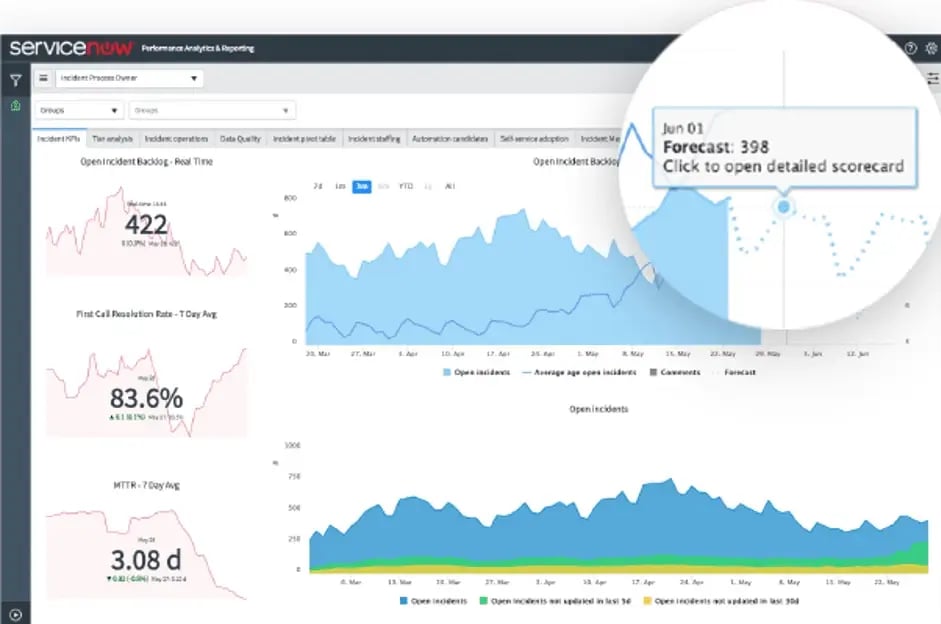
But wait, there’s more! You have the power to predict the capability of business processes on your journey to success. Amongst service management, you can use ServiceNow PA to predict KPI’s like open incidents and be able to see where you were today, but where you’re headed in the future as displayed:

The ROI for Enterprise Software?
How do you know if you’re utilizing the full value of your ServiceNow investment? How do you measure this? Regardless of the module, you are using, at some point, you will want to track the growth and adoption of the technology and measure the return on your software investment back to your company.
With hundreds of applications that customers find for performance analytics, the most dominant use cases revolve around the use of PA data-driven metrics to calculate business ROI. Performance analytics let you measure business value by looking at your KPI’s traditionally over time. This allows you to track your organization’s growth against initial expectations to assign a budget to specific indicators.
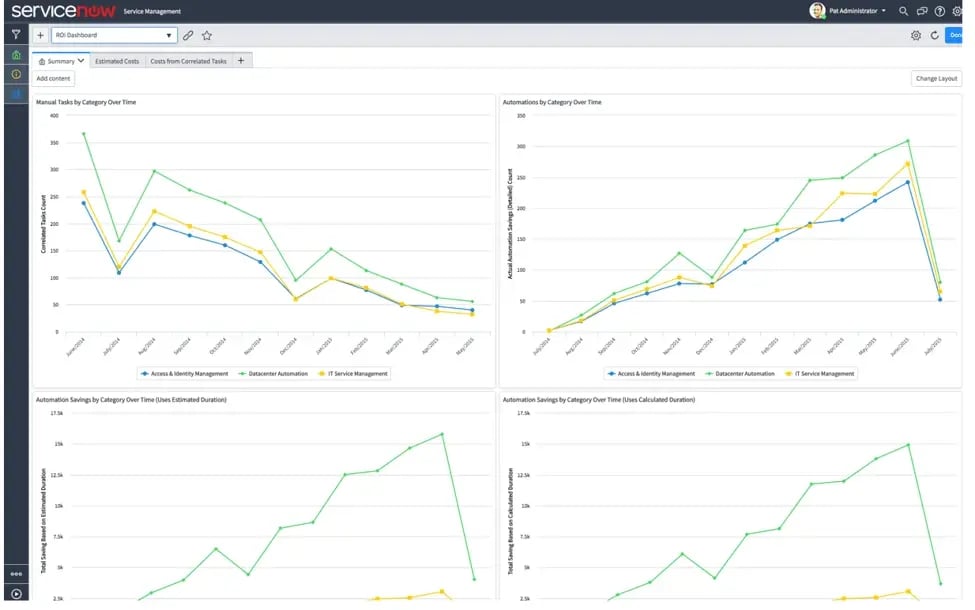
The ROI dashboard below is a great example of how ROI is displayed.

The dashboard displays KPIs on process automation and how applications improve the comprehensive ability of the business. This visualization is so important because it shows the correlation between business processes and the descending trend in new service desk ticket submissions and the cost savings.
Primary reporting enables you to understand what’s happening within your ServiceNow application at any time and also ServiceNow PA improves visibility into project management. Without a traditional context, it is extremely difficult to know whether your application is providing true value or not. But performance analytics allow you to track application KPIs overtime periods, providing insight on how your organization is performing. This new knowledge can be used to improve your business with continual service improvement with ServiceNow investment.


