Organizations across various industries are constantly seeking ways to accelerate automation, improve their operational efficiency, enhance customer satisfaction, and drive better business outcomes. One tool to help you address all these needs is ServiceNow Performance Analytics. The robust performance analytics platform in ServiceNow empowers businesses to gain valuable insights, make data-driven decisions, and optimize their processes for improved performance. This article gives you complete information on how the ServiceNow performance analytics platform helps businesses achieve IT service goals and stay competitive.
What Are the Benefits of ServiceNow Performance Analytics Platform
Comprehensive Data Visualization
ServiceNow Performance Analytics provides businesses with a comprehensive and intuitive visualization of their data. It allows organizations to create customizable performance dashboards and reports, including key performance indicators (KPIs), in a visually appealing and easy-to-understand manner. By consolidating data from various sources and presenting it in a unified view, businesses can quickly identify trends, spot anomalies, and gain a holistic understanding of their operations. Moreover, performance analytics dashboard widgets enable organizations to define visualizations for a particular KPI by applying filters or segmenting indicator scores based on the requirement.
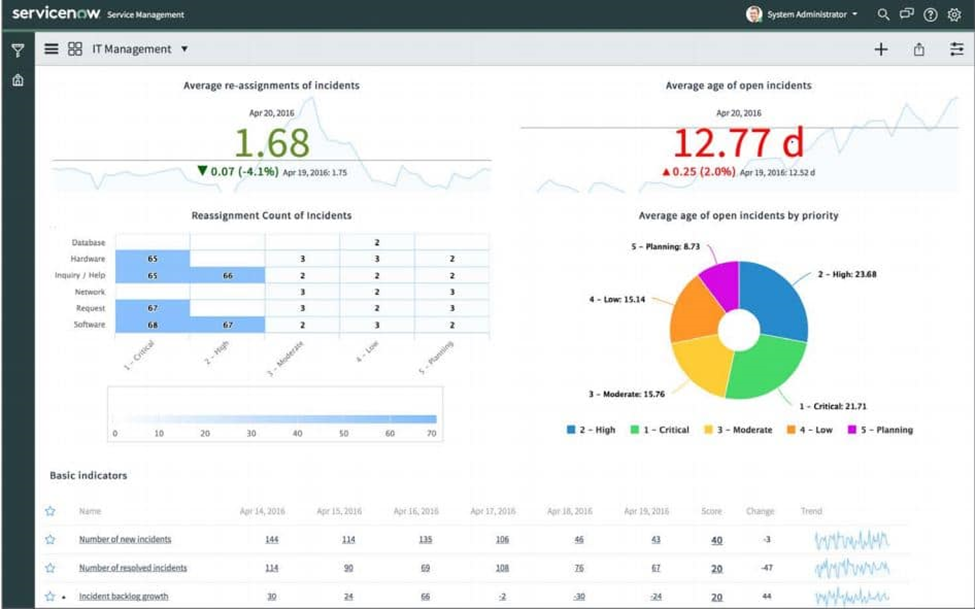
Figure: ServiceNow PA dashboard showing performance against business goals
Real-time Monitoring and Alerts
Monitoring performance in real-time is crucial for businesses to respond promptly to issues and ensure continuous improvement. ServiceNow performance analytics enables organizations to set up real-time alerts and notifications based on predefined thresholds or conditions. This proactive approach helps businesses identify and address performance bottlenecks, service disruptions, or deviations from desired performance levels, minimizing downtime and reducing the impact on operations.
Performance Benchmarking and Goal Setting
ServiceNow performance analytics’ customizable performance dashboards allow businesses to establish performance benchmarks and goals based on industry standards, best practices, or internal targets. By comparing their performance against these benchmarks, organizations can identify areas for improvement and set realistic goals for their teams. This feature encourages accountability, fosters healthy competition, and drives continuous improvement across the organization.
Root Cause Analysis
Root cause analysis is key for measuring the performance metrics for business success. In complex business environments, identifying the root causes of performance issues can be challenging. ServiceNow performance analytics provides powerful analytical capabilities to help businesses delve deep into their data and uncover the underlying factors contributing to performance problems. By identifying the root causes through the ServiceNow platform, organizations can take targeted actions to address the issues, optimize their processes, and drive efficiency.
Data-driven Decision Making
ServiceNow performance analytics platform empowers businesses to make data-driven decisions at every level of the organization. By providing actionable insights and performance trends, organizations can optimize their workflows, allocate resources effectively, and identify areas of improvement. Whether it's streamlining customer service processes, optimizing IT operations, or enhancing employee productivity, ServiceNow performance analytics equips businesses with the information needed to make informed decisions and drive positive outcomes.
Continuous Improvement and Iterative Optimization
ServiceNow supports a culture of continuous improvement by providing organizations with a platform to monitor performance, analyze data, and iterate on their processes. By leveraging historical data, performance analytics platform can track KPIs progress over time, identify improvement opportunities, and implement iterative optimizations. This iterative approach helps businesses stay agile, adapt to changing market dynamics, and drive sustainable growth.
Conclusion
ServiceNow Performance Analytics serves as a powerful tool that measures performance metrics for business success. From delivering data insights, optimizing performance, and making data-driven decisions, performance analytics platform with customizable performance dashboards helps organizations drive efficiency, enhance customer satisfaction, and achieve their IT service goals at reduced costs.
V-Soft Consulting is a leading ServiceNow consulting services company specializing in integrating performance analytics within ServiceNow and optimizing automation procedures. As a ServiceNow Elite Partner, we help you maximize automation levels and enable self-service options within your ServiceNow platform to take IT service efficiency to new heights.
Talk to our certified ServiceNow consultants to learn more about how ServiceNow’s performance analytics plugin helps businesses monitor KPIs while ensuring exceptional service delivery.