Often times I get asked by customers, “Why do I need Performance Analytics (PA) when ServiceNow comes with plenty of reports?” It’s a fair question and goes to the heart of any analytics discussion. Here I will share the power of PA for you to consider as you have likely already made the investment, why not turn your ServiceNow capabilities up if you can find the value?
Performance Analytics vs ServiceNow's Basic Reporting
Let me start by contrasting basic reporting and business analytics. Basic reporting gives you the ability to understand what is happening now. Within the context of service management, this could represent an ad-hoc request for something like the number of tickets my team is currently working on, how many are open, how many were closed today, and so forth.
Good information, right? ServiceNow reporting gives me a nice snapshot of what’s happening at the moment. However, what if you need to understand trends such as “are we improving”, or “where are we spending the majority of our time”, or “how many tickets are we resolving on the first call?”
This is where the power of analytics comes in. Performance Analytics (PA) provides historical context so you can start answering questions that speak directly to the overall health of your business. Oftentimes, just one dashboard can show you more useful information than spending hours looking at spreadsheets as the sample below illustrates.
ServiceNow Dashboard
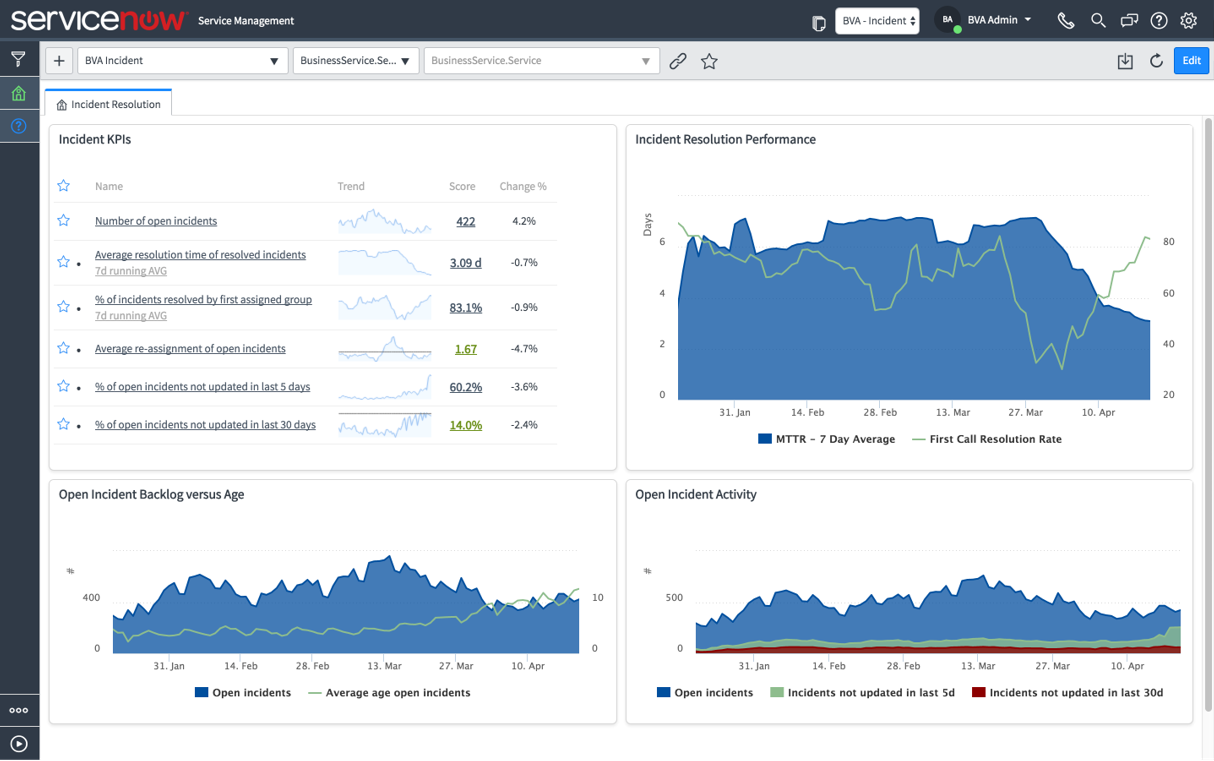
Consider the power of this dashboard for a moment. At a glance, you can see key performance indicators (KPI’s) like the average time it takes to resolve a ticket, how many tickets are resolved on the first call, trends over the last several months, the average age of a ticket and how many open tickets are aging or haven’t been recently updated.
So, getting back to the original question around the value of analytics, without historical context, it is difficult to measure the health of your business. Looking at daily reports can only tell you so much.
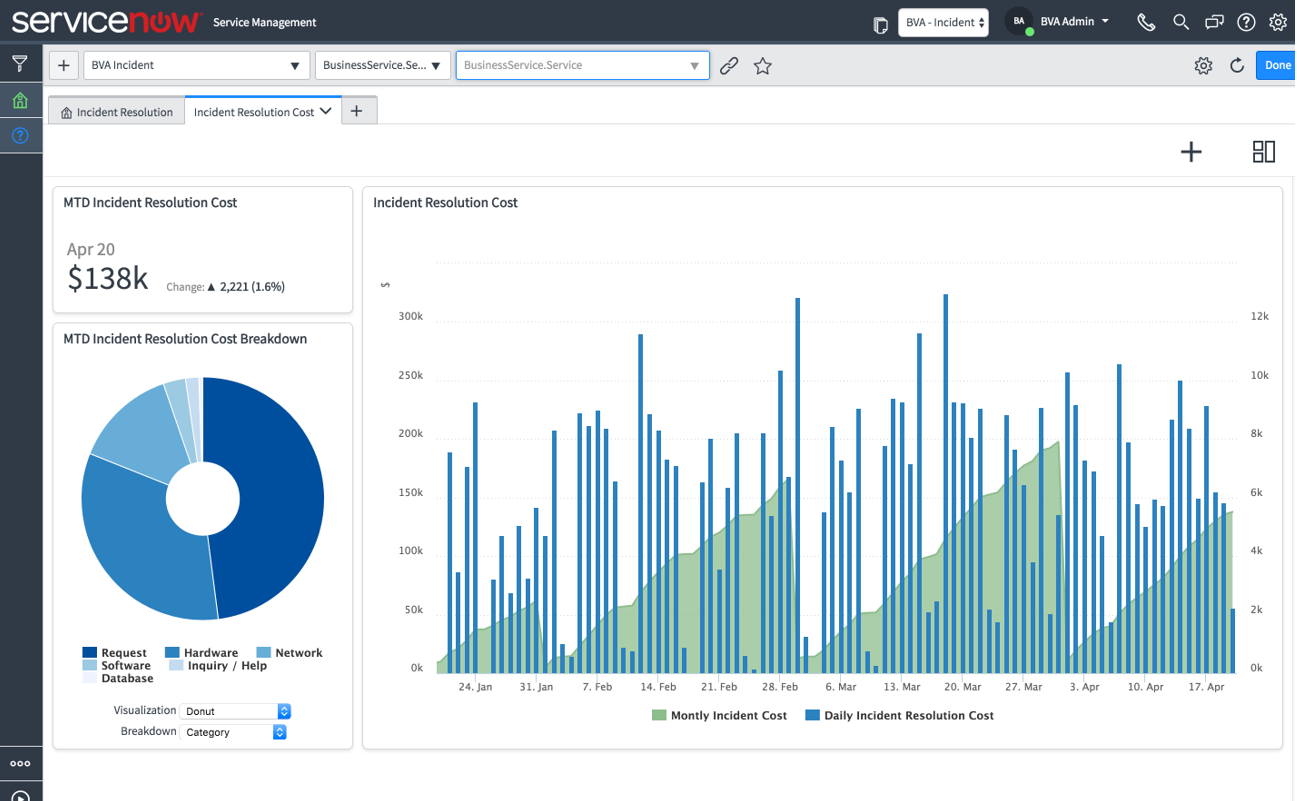
Let’s walk through a few more examples to show the power of analytics. Say you need to know what the impact of a new hardware upgrade has on your incident resolution cost. To do this, you can use PA to look at your distribution of tickets over time like the dashboard below . . .
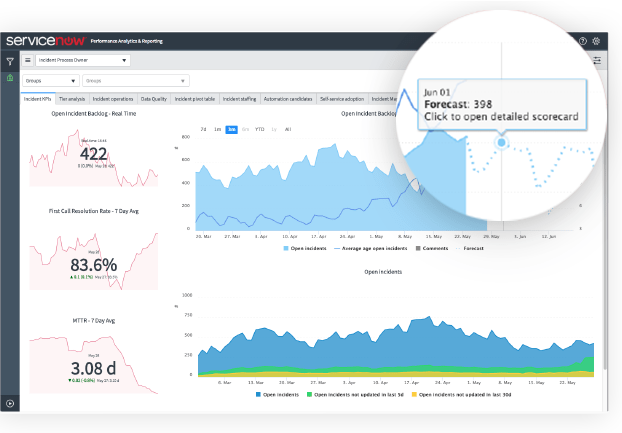
And it gets better! What if you could predict the effectiveness of your business processes in the future? This is where the power of analytics is truly realized. Staying with our service management example, you can use PA to forecast KPI’s like open incidents, so now you can see not only where we were and where we are today, but where we’re headed in the future as illustrated below . . .
Is PA just for Service Management?
I’ve limited this discussion to the IT service desk for sake of expediency. However, PA is available and can be applied to almost any ServiceNow application. So, we could have easily focused the discussion on the problem and change requests, or we could apply similar measurement strategies to your HR, CSM, SecOps, or SPM (formerly ITBM) application.
ROI for Enterprise Software?
Oftentimes, I ask customers if they can tell me whether they’re realizing the full value of their ServiceNow investment. The most common response is “I’m not sure” or “how do you measure this?” Regardless of which module you are using, at some point, you will probably want to track the progress and adoption of the technology or measure the return on your software investment back to the organization.
There are literally hundreds of applications customers find for PA, but at the end of the day, one of the most compelling use cases I’ve seen revolves around the use of PA data-driven metrics to calculate business ROI. As discussed, PA allows you to measure business value by looking at your KPIs holistically over time. This allows you to do useful things like track your organization’s progress against initial assumptions and assign a dollar value to specific indicators.
The ROI dashboard below is one example of how you might answer this question.
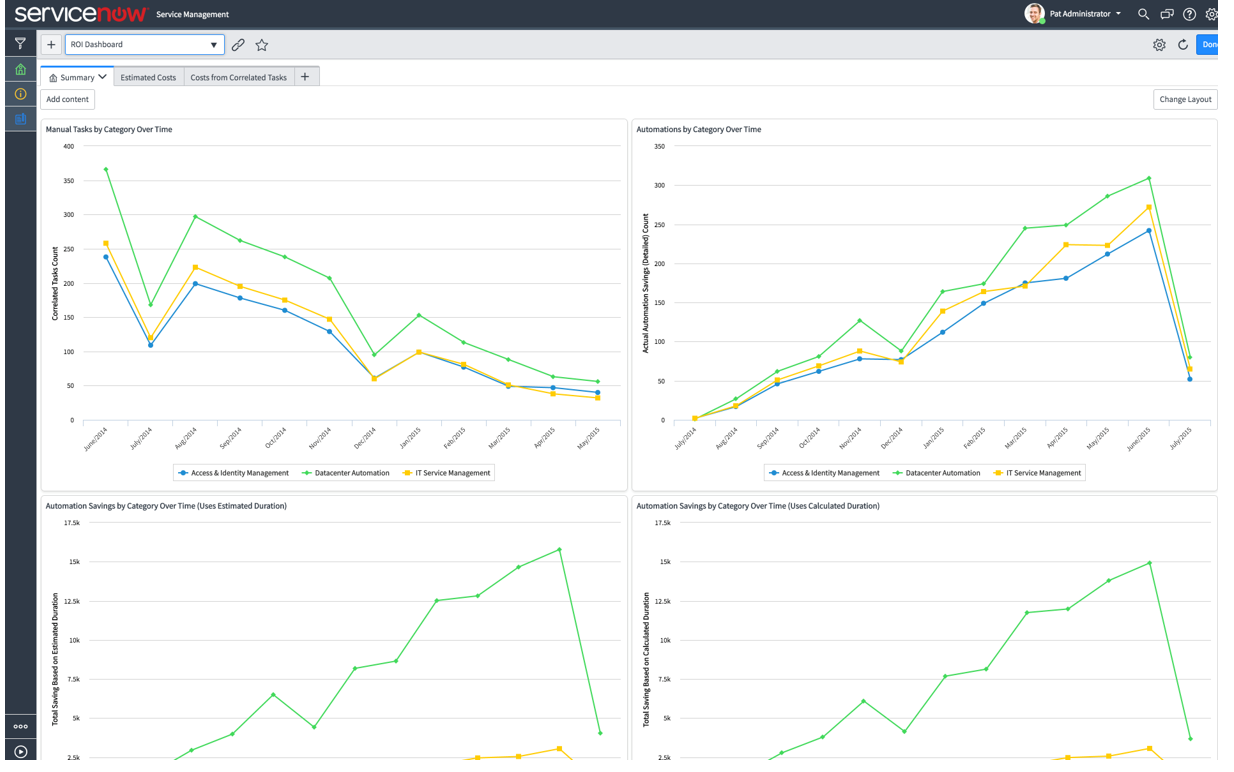
As you can see, this dashboard reflects KPIs on process automation and how its application has improved the overall efficiency of the business. What makes this visualization so powerful is not only can we see the correlation between business processes and the downward trend in new service desk tickets, but the resulting cost savings are tracked as well.
Tying It All Together
Basic reporting allows you to understand what’s happening in your ServiceNow application at any given time. But without historical context, it’s difficult to say whether your applications are providing true business value. Performance analytics, on the other hand, allows you to track application KPIs over time giving you insights into how your business is performing. You can use those insights to improve your business through a strategy of continual service improvement and to justify your ServiceNow investment.
Performance Analytics allows you to move away from “seat of the pants” decision-making or time-consuming spreadsheet analysis to a data-driven approach that’s automated, secure and lives on the ServiceNow platform.